If you can use duct tape, you can perform an Ogilvie DFEC analysis in 5 minutes

An Ogilvie / DFEC analysis isn’t really difficult, especially when this website has a free Ogilvie / DFEC calculator. ((Photo courtesy of indigotimbre)) The problem comes when you have to prove all the math behind those calculations.  This involves “showing your work.”

The best way to “show your work” is to take the reader through each step of the Ogilvie analysis.  I’ve prepared a sample report (generated using a new service on this website) which provides a clear and easy to understand format for “showing your work.”

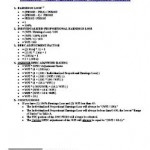
The steps are basically this:

  • Step 0:  2005 PDRS rating string
  • Step 1: Post-Injury Earnings of Applicant
  • Step 2: Post-Injury Earnings of Similarly Situated Employees
  • Step 3: Calculate Proportional Earnings Loss
  • Step 4: Calculate Individualized Rating to Loss Ratio
  • Step 5: Compare Individualized Rating to Loss Ratio to range of ratios for the FEC ranks

For those interested, here’s a more detailed explanation of each step in an Ogilvie / DFEC analysis.

When each step of the Ogilvie / DFEC analysis is stated clearly, the reader can see every assumption, step, and perform their own calculations to verify your conclusions.  As long as the parties agree on the numbers used in an Ogilvie / DFEC calculation, they should always arrive at the same result.

Setting forth every single step of your Ogilvie / DFEC analysis lets you to spend less time arguing about the impact of Ogilvie and more time trying to get the case settled.

Building the case for a DFEC rebuttal
Q: How do you build the case for a DFEC rebuttal? A: One step at a time.

There’s a lot of conflicting information about what Judge’s are requiring to making a finding of a DFEC rebuttal under Ogilvie v. City and County of S.F..  ((Photo courtesy of eliaspunch))  The Board in Ogilvie II is explicit that all you need is post-injury earnings information for the injured worker and similarly situated employees and “simple mathematical calculations with that wage data” using a “non-complex formula.” ((Ogilvie II, p1-2.))

Unfortunately, calling a process “simple” and “non-complex” doesn’t necessarily make it so.  Apparently some Judges are requiring some additional showing beyond wage data and “simple calculations.”

What are Judges in your area requiring?

  • Just wage data and calculations? ((Perhaps just a print-out from PDRater?  ;) ))
  • Vocational testimony/evidence regarding earnings?
  • Proof of attempts to seek employment/motivation?
  • Something else?

Share your insight with an e-mail or comment.

Back to the drawing board

DOWNLOAD THE MATHEMATICAL PROOF AS A PDF!

A little while ago William S. Morris, an Applicant’s attorney, told me that the Ogilvie adjustment calculation could be further simplified.  ((Photo courtesy of Dahveed76)) He suggested the following ((I’m paraphrasing here)) :

  1. Earnings Loss ((PIESSE = Post Injury Earnings of Similarly Situated Employees)) ((PIEA = Post Injury Earnings of Applicant))
    1. L = (PIESSE – PIEA) / PIESSE
  2. Individualized Proportional Earnings Loss
    1. = (WPI / L) / 100
  3. DFEC Adjustment Factor
    1. = ([1.81/a] * .1) + 1
    2. = ( (1.81 * .1)/a) + 1
    3. = (.181/a) + 1
    4. = 1 + (.181/a)
  4. Ogilvie DFEC Adjusted Rating
    1. = WPI * DFEC Adjustment Factor
    2. = WPI * (1 + (.181/a) )
    3. = WPI * (1 + (.181 / Individualized Proportional Earnings Loss) )
    4. = WPI * (1 + (.181 / ( (WPI / L) / 100) ) )
    5. = WPI * (1 + (18.1 / ( (WPI / L)  ) )
    6. = WPI * (1 + (18.1 * (L/WPI) ) )
    7. = WPI + (18.1 * L)
  5. Conclusion
    1. If the injured workers’ individualized proportional earnings loss is outside all of the FEC ranks, you may calculate the Ogilvie adjustment by adding (18.1*Earnings Loss) to the WPI.

The only flaw with the proofs offered by William and myself is that they are too exact.  The WCAB in Ogilvie never sets forth the exact process for performing the Ogilvie adjustment calculation – so the only official method involves rounding to different significant figures at different places.  Thus, a calculation performed in strict accordance with the WCAB in Ogilvie and through one of these mathematical proofs would differ very slightly.

What do you think? Leave a comment or drop me a line.

Hey everyone!  More workers compensation calculators!
Hey everyone! More workers' compensation calculators!

I’m working on several more workers compensation calculators.  I’m really excited about one of them in particular.  ((Photo courtesy of Wal mink))

I’ve been working to develop calculators and search engines that are easier to use, easier to understand, and make them available to everyone for less than my competitors.  One benefit to doing it all myself is that I can innovate faster than anyone else.  For instance, my wildly popular Ogilvie calculator was available to beta testers just days after the Ogilvie case came out.

But, this new calculator is something entirely new.  Tantalized?  Titilated?  Tremulous?

Stay tuned!

lincolnblues
Even this guy can do the Ogilvie adjustment calculation in his head

If you’re using my Ogilvie calculator for situations involving a 100% earnings loss, you’re working too hard.  ((Photo courtesy of lincolnblues))

If you have 100% earnings loss and WPI less than 45, the Ogilvie adjustment formula will always result in WPI + 18.

Not to worry.  I can make Ogilvie even easier:

  1. [download id=”1″].
  2. [download id=”2″]!

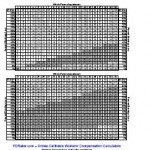
The Ogilvie mathematical proof has been available for several weeks for peer review.  I’ve only received positive feedback. ((An anonymous source from the DWC actually called it “cool”!))  The above Ogilvie Adjustment Chart has been testing by myself and other workers’ compensation attorneys, but like everything else on this site is provided subject to all legal disclaimers.

Here’s a peek at what they look like:

Ogilvie Mathematical Proof

Ogilvie Adjustment Chart